Home LED Lighting Nerd-Fest
 Making an energy-efficient house as cost-effective as possible.
The full spreadsheet in all its glory is here: https://docs.google.com/spreadsheets/d/1FvSf6zxc9v2ucQ7ymf_zEcIRFE4ckS6JlMHY0qF1ue4/edit
Goal
We moved into a new home and I wanted to see how easily I could save money on my energy bill. I also didn’t want to spend a small fortune on expensive LEDs unless it would be cost-effective, so that led me to making a sweet spreadsheet!
Sequence
I walked through the house and wrote down what type of bulb was in each fixture and how many watts it used.
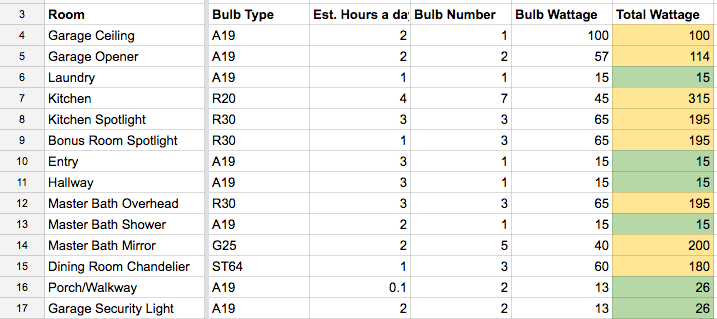
Then I estimated how many hours a day each fixture was turned on for. I used my best guesstimate from what seemed reasonable on average.

Next I researched replacement bulbs and added how much they cost and how many watts each used.

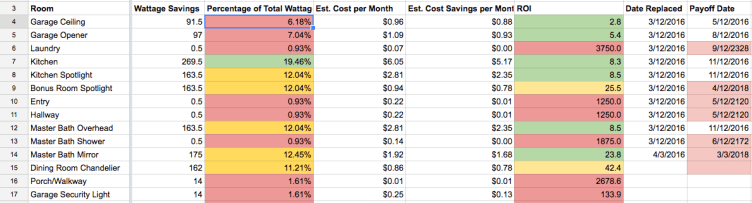
Finally, I estimated the cost savings per month and that allowed me find the payoff date for each fixture.
LED Vs CFL
In most cases LEDs were more efficient than their equivalent CFLs, but that came at a higher price. Most LEDs tended to be around 75% of the power usage of CFLs but cost 2X to 4X more per bulb. As a rule, I replaced any incandescent and halogen bulbs with LEDs since the payoff was usually under a year. Some were already CFLs and this increased the payoff date significantly since these bulbs were fairly efficient. The payoff is figured by taking Column J, Total Replacement Cost:
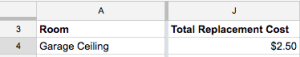
And dividing it by Column N, Est. Cost Savings per Month:

To find Column O, ROI that spits out the payoff in months:

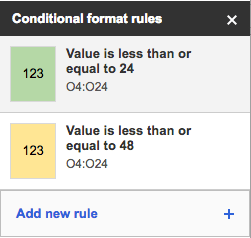
The color for Column O was changed to Red and then conditional formatting was changed to make it Green if the payoff is 24 months or less and Yellow if it is between 24-48 months:
Outliers
In some cases I replaced CFLs with LEDs even though the payoff was beyond a year (or in the case of the master bathroom shower lights 57 years). This was mostly to get more light in certain rooms that didn’t have many fixtures. At night the laundry room is pretty dark, and even if it never pays for itself I’m hoping the other bulbs pay it off for me.
Final Results
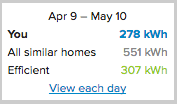
Since I don’t have any electricity bills from before we moved in, I can’t compare directly how much power I saved. The best I can do is look at the results and estimate the savings. Our bills since moving in the beginning of March show that our usage ranges from a low of 278 kWh to a high of 524 kWh. June and July both have significantly more consumption, and that was definitely from running the A/C more!

The August bill will be helpful since we haven’t run the A/C very much to see what the typical consumption is.
My estimated usage before installing LEDs is 107.64 kWh. After installing the new lights the consumption should be 19.02 kWh, giving me an estimated savings of 88.6 kWh. The cost savings at my Tier 1 rate of $0.18212 per kWh is $16.14. At the Tier 2 level of $0.2409 the savings are more significant at $21.34 a month. With a total investment of $186.58, it will take approximately 11 1/2 to 8 3/4 months to pay off all the lights depending on Tier you calculate it at. Overall, totally worth it to me.
0 Comments on “Home LED Lighting Nerd-Fest”